By Bradleigh Ward, Search & Content Manager at SaleCycle
Using data and insights from the SaleCycle 2021 Fashion Ecommerce Stats & Trends Report we explore online sales and trends, cart abandonment statistics, luxury vs consumer fashion buying habits, email marketing statistics, online traffic trends and individual product buying habits.
In this article we’ve cherry picked some of the most essential fashion ecommerce stats and data and we analyse what this means for the state of fashion ecommerce. The data and insights in this article is just a small snippet of what’s available in the full report.
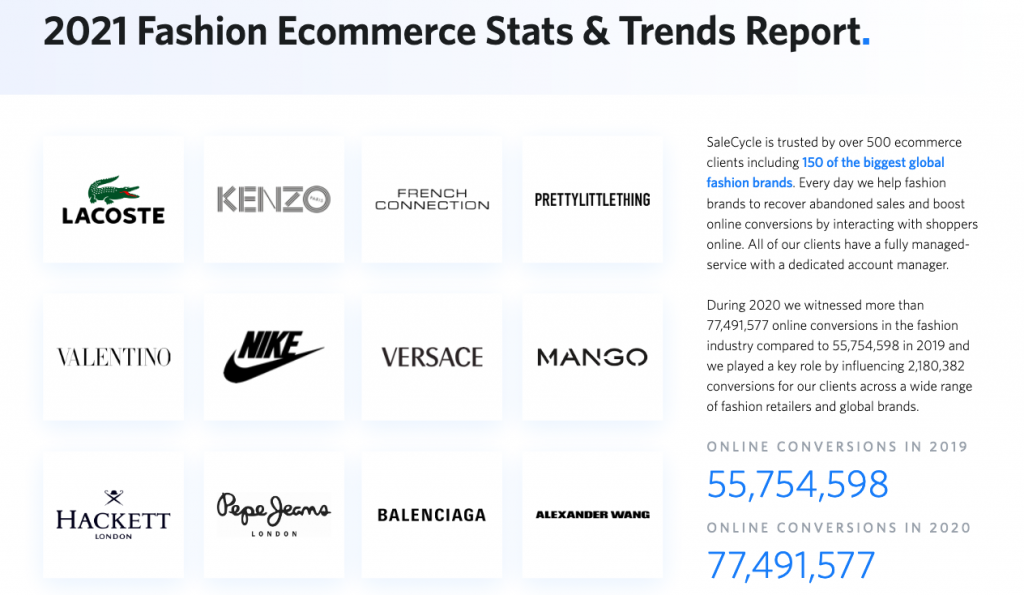
Our fashion ecommerce insights are harvested from over 77,491,557 user-journey’s from over 150 of the world’s biggest fashion brands. We use this data to understand how and why online customers in the fashion industry behave.
Online Sales by Device in Fashion
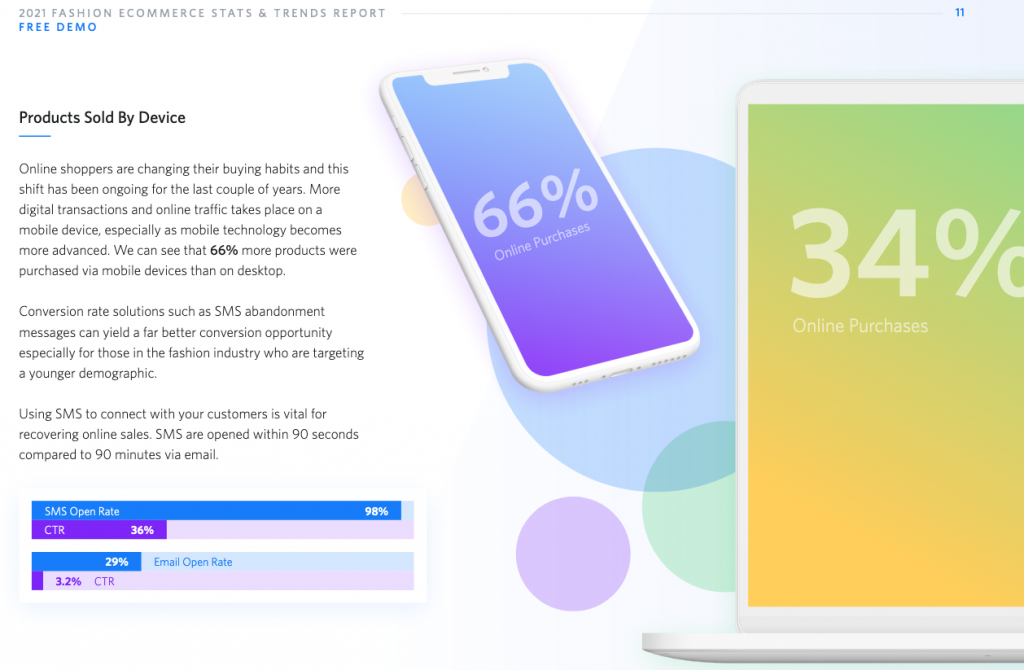
Mobile online sales in the fashion industry in 2020 accounts for 66% and 77% of all online traffic. This paints a simple picture of the fashion industry, which is online customers browse and convert on mobile devices. There is a real opportunity for fashion retailers to use this growing trend to make marketing campaigns, user experience and checkout processes more effective on mobile devices, where most of their customers are.
Using solutions that target customers via mobile devices can yield high ROI. For example, SMS are opened within 90 seconds compared to 90 minutes via email. SMS open rate is 98% with a click through rate of 36%, compared to email click through rates of 3.2% and open rates of 20%.
Online Traffic In Fashion
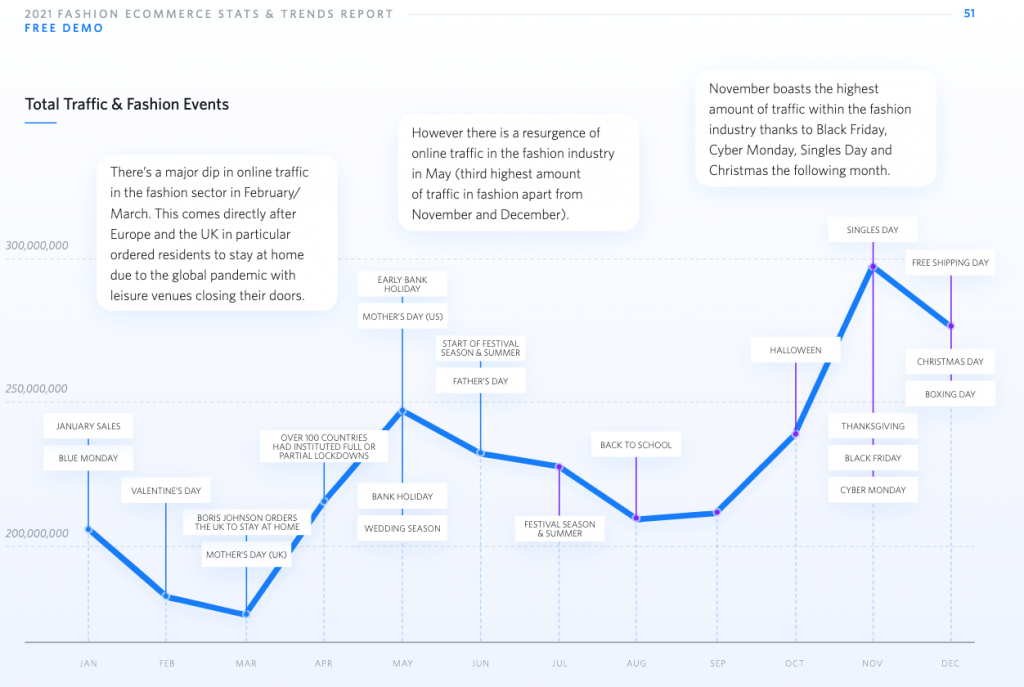
There are two main peaks in online traffic within the online fashion sector. Of course, November sees the highest number of online customers thanks to online sales and gift-giving events like Black Friday, Cyber Monday, Thanksgiving, Singles Day and Christmas around the corner. We also notice strong activity in May to July around the start of summer and festival season.
However there is a clear dip in online traffic in February/March, which could be a result of COVID-19 restrictions coming into play. The online fashion traffic share could have shifted to the retail sector where groceries and pharmaceutical products online sales surged.
Although, the general fashion traffic trends show activity from May-July and October-December. The customers in this sector are heavily affected by seasonality and their online behaviour reflects this.
Cart Abandonment In Fashion
Fashion online enjoys some of the lowest cart abandonment rates of the sectors we monitor. However, the COVID-19 pandemic has slightly changed this trend as more online shoppers were keen to complete their food shopping online, therefore bringing retail cart abandonment (77.01%) to their lowest rates in years.
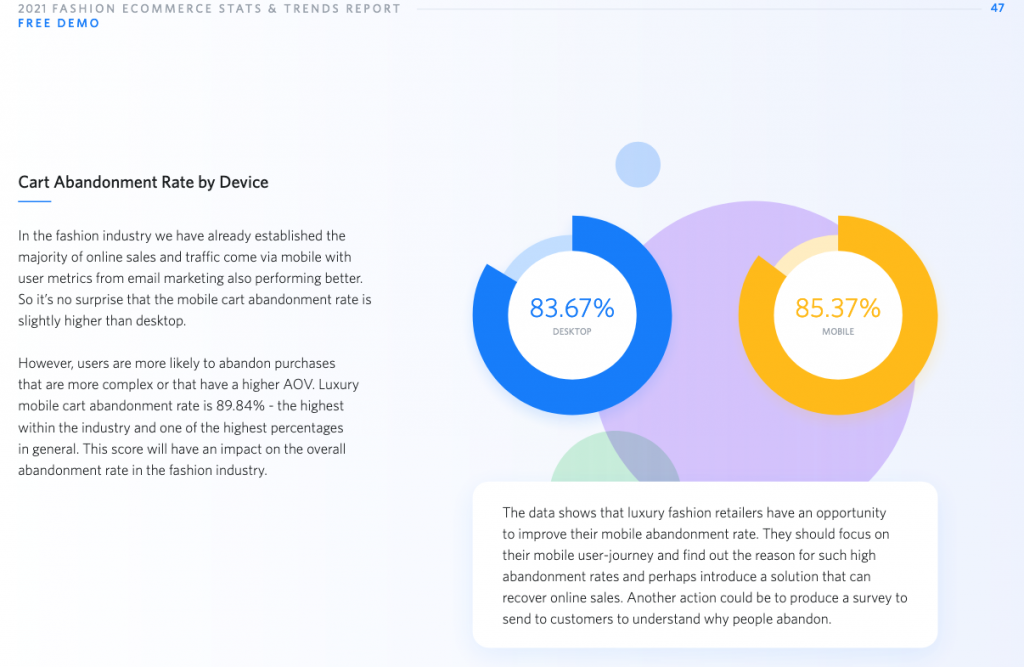
The overall cart abandonment rate for ecommerce in 2020 was 82.16% with fashion coming in at 84.85%. Cart abandonment is going to happen in ecommerce but the key is putting the right solutions in place to reduce the number of abandoners you have.
If we look at cart abandonment rate by region the charts show us North America has the highest abandonment rate out of the three mature markets: Europe, Asia & Pacific and North America. Europe by contrast has the healthiest abandonment rate, especially via desktop.
Email Marketing In Fashion
Email marketing is an important marketing channel for ecommerce retailers. For example, a census report found 73% of the census sample ranked email marketing as an excellent marketing source for ROI. Putting it ahead of SEO and Paid Search.
However, it’s important to note that SEO and Paid Search are the building blocks to your email database. Marketing campaigns are their most effective when they work in tandem with each other to create an integrated marketing strategy.
There are a trio of email marketing metrics to be aware of: open rate, click rate, conversion rate. These metrics can be used to benchmark and analyse your own marketing efforts.
When we compare retail to fashion we can see that open rates and click rates are stronger in retail. Interestingly, the conversion rate in fashion performs better. This is likely due to the extra focus on conversion marketing and solutions in emails such as promo codes, countdown timers, cross sell and upselling and other marketing tools.
Online Fashion Products Trends
Below we dig into product trends as a collective and we also provide some insights into individual product performance online. However, for a lot more data and insights on individual products make sure to download the SaleCycle 2021 Fashion Ecommerce Stats & Trends Report.
Products Sold By Day
Our previous ecommerce data report found Thursday was the most popular day for online sales across the board. Our latest data also finds that fashion ecommerce online sales is also at its peak on a Thursday with Saturday showing the least amount of sales volume.
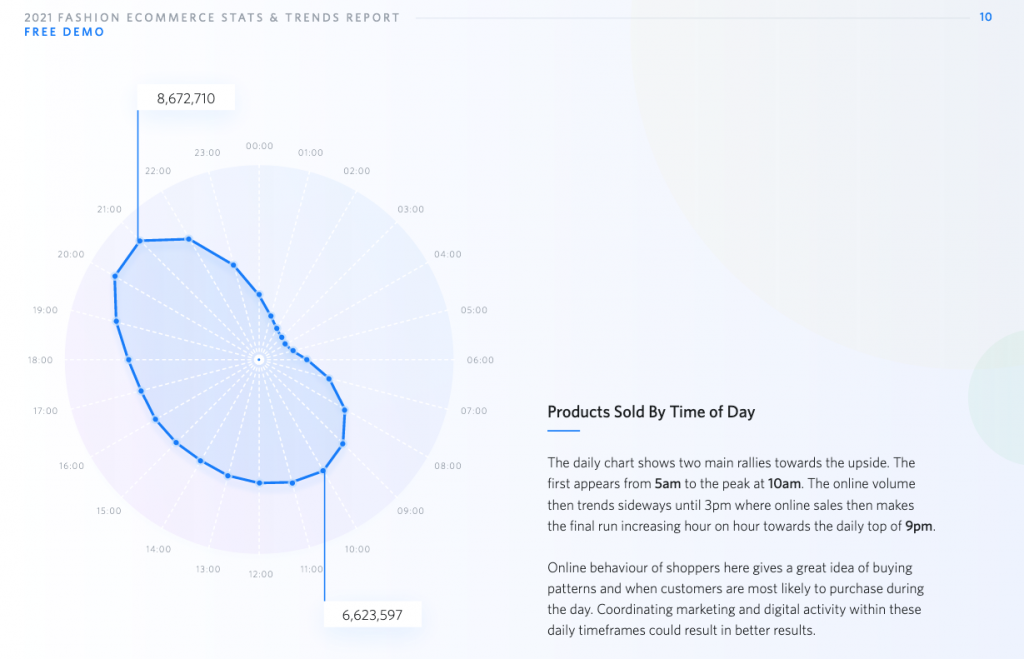
Products Sold By Time of Day
The daily online sales chart shows two main rallies towards the upside. The first is from 5am to 10am and the second is 3pm to 9pm where sales reach their peak.
Between 10am and 3pm the online sales volume remains stable in a sideways pattern.
Trend of Sizes Over Time
Different sizes shift with the market sentiment and market style. For example, some fast fashion styles are oversized and baggy and others are tight fitting.
The most popular size of clothes purchased in 2020 was medium and in second place was small. Understanding fashion movements and fast fashion trends could improve ROI as you learn to manage stock levels with the trend.
Loungewear Insights
Loungewear sales volume peaks on a Sunday, which is the only category in fashion that does not see its highest sales volume on a Thursday.
This is a major shift in buying habits and goes against the main trend within online fashion.
About SaleCycle 2021 Stats & Trends Report
SaleCycle has worked with hundreds of ecommerce clients over the past ten years, helping them to recover abandoned sales, and increase online conversions.
SaleCycle provides a comprehensive overview of the state of ecommerce in 2020. Data from over 150 million online conversions and user journey’s witnessed across many sectors including retail, fashion and travel has been used to create this report.
We provide detailed insight on 3 segments and multiple sub-segments in the areas of retail, fashion, travel and more. We also dig into global trends, conversion rate optimisation, online behavior and more.
For this report, we’ve collected a wide variety of data which shows ecommerce sales growth and patterns. We explore how shoppers behave across different sectors and devices, and abandonment trends.
Download SaleCycle 2021 Fashion Ecommerce Stats & Trends Report